
A Blindspot deep dive
Steam to Chips: History rhymes?
In 1847 Britain poured roughly 7% of its GDP into railways, and its railway construction workforce was about twice the size of the British Army. The railways became the backbone of the economy. The boom that built them ended in a bust, and when America repeated it, more than 27,000 miles of railroad went into receivership in 1893 alone. In 1900 the railways still made up 63% of US stock-market value. The technology had won. Many of the people who paid for it had not.
The same story has been told six more times since. America had 272 car makers in 1909 and nine by 1941, while the Model T fell from $850 to as little as $260. After deregulation, US airlines filed for bankruptcy 198 times by the industry body’s unofficial count, while real fares fell by roughly half. Memory prices collapsed, and by McKinsey’s reckoning memory makers created no economic value between 1996 and 2012. Telecom carriers put more than $500 billion into networks, and telecom shareholders lost roughly $2 trillion while bandwidth became nearly free. US newspapers lost 87% of their real advertising revenue between 2000 and 2020 as information became free. Nokia sold 49.4% of the world’s smartphones in 2007 and sold its devices business six years later. Each time a scarce, premium service drew in capital, capacity overshot, the price collapsed, most entrants failed or were absorbed, and a few survivors were left running something close to a utility. The sector indices fell between 70% and 98%, and the bust came after the peak in capital spending, not the peak in the technology.
AI now looks uncomfortably familiar. US spending on information-processing equipment and software is a larger share of GDP than at the height of the dot-com boom, and the stocks selling into it have started to fall. The price collapse is already here: OpenAI’s list price per million input tokens went from $30 for GPT-4 to $1.25 for GPT-5. The shakeout has begun quietly, through licence-and-hire deals rather than failures. For now the main supplier keeps the margin while the model builders’ results are mixed, and index concentration is at a record, with the Magnificent Seven at 34.9% of the S&P 500 at the end of 2025. What may be different is who is paying: some of the most profitable companies in history, though their cash-flow cushion is thinning.
This note follows the seven cycles in turn, sets AI against a four-part scorecard, and ends with the signals that will show whether the rest of the arc arrives: the IT investment line in the GDP figures, hyperscaler capex guidance and how it is financed, the gap between open and closed models, neocloud credit and the IPO window, and the chip index against its June high. History is better at the shape of a cycle than its timing. The question running through every page is the old one: when the technology wins, who keeps the gains?
AI Spending Tops the Dot-Com Peak: Seven Tech Cycles Show What Follows
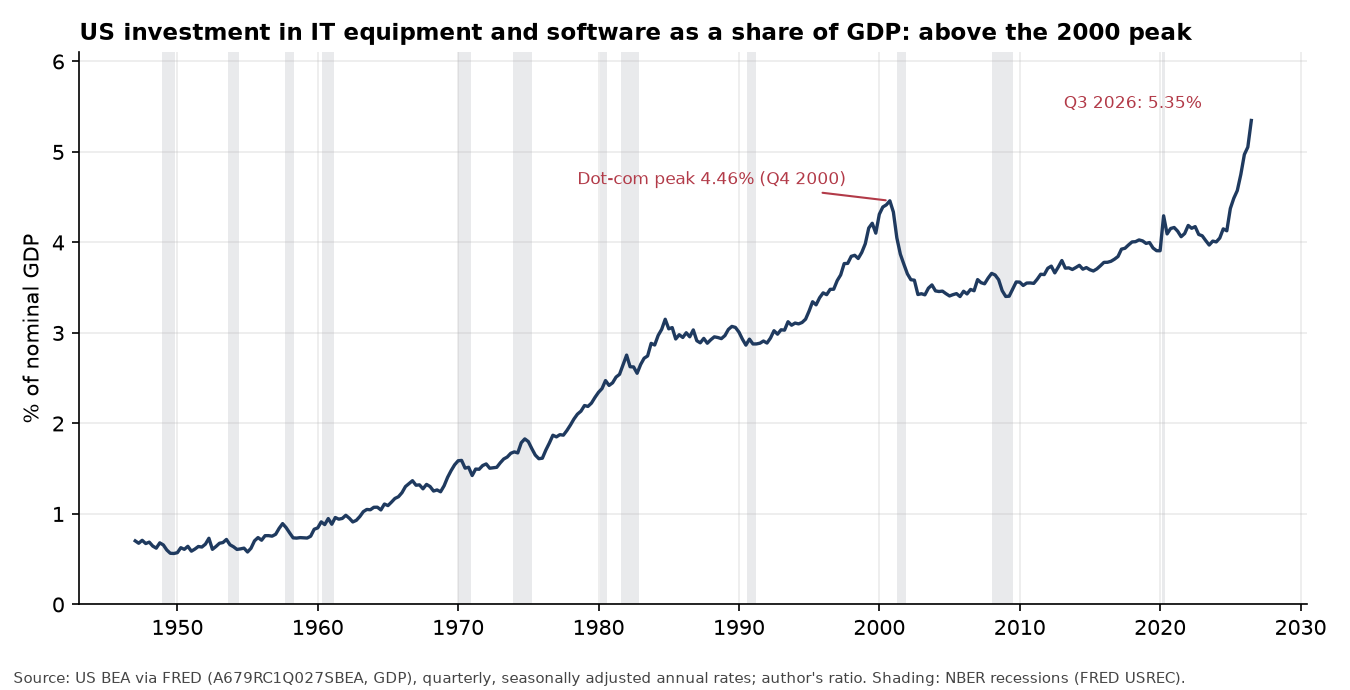
On the latest figures, to 13 November 2026, three numbers stand out. US investment in information-processing equipment and software reached 5.35% of GDP in the third quarter of 2026, above the 4.46% peak of the dot-com boom in the fourth quarter of 2000 1 (chart 5). Nvidia, the AI build-out’s main supplier, had lost about 30% of its value in six straight weekly falls since early October, roughly $1.7 trillion, to 13 November 2. And the PHLX Semiconductor Index closed at 10,146 on 13 November, about 29% below its June month-end close of 14,247 and about 31% below its record daily close of 14,635 on 22 June 3, 4, 5.
The first warning came almost two years ago. On 27 January 2025 Nvidia fell 17% and lost between $589 billion and $593 billion of market value in a single session (about $618–622 billion in 2026 dollars)¹, after the Chinese lab DeepSeek showed a capable model built cheaply (Reuters, which put the loss at $593 billion on LSEG data 6; Yahoo Finance, $589 billion 7). For one day, the market priced the possibility that AI might become a commodity. History says that possibility deserves more than a day’s attention.
What history suggests: Every big technology of the past 180 years went through a price collapse, a shakeout and a handful of winners, and what usually hurt investors was the capex cycle and index concentration around the technology rather than the technology itself. AI already shows the price collapse, a record capex share of GDP and record index concentration; the shakeout, and the fight over who keeps the gains, have only just begun.
The pattern
The sequence repeats with remarkable regularity. A new technology arrives as a scarce, expensive, premium service. Spectacular early returns pull in capital. Capacity overshoots demand, the unit price collapses, most entrants fail or are absorbed, and a few survivors run what remains as a utility-like business. Users capture most of the gain. The technology wins; many of its financiers lose.
The scorecard below sets out how far AI has travelled along that path. The seven historical cycles behind it follow: railways, cars, air travel, digital electronics, telecom fibre, information services and mobile phones. Then come what the pattern means for a book, the AI evidence in detail and what to watch. The full data tables are on the MoneyTurkey data page.
Scorecard: is AI following the commoditisation pattern?
| Pattern | What history shows | Is AI showing it yet? | Evidence (date-stamped) |
|---|---|---|---|
| Price collapse | Model T $850 → $260 (about $31,900 → $5,000 in 2026 dollars); memory about 1,000× cheaper in real terms, 2000–23; IP transit $1,200 → $0.63 per Mbps, 1998–2015 (about $2,480 → $0.90 in 2026 dollars) | Yes | Fixed-capability inference 9×–900× a year cheaper 8; about 10× a year 9; OpenAI list prices $30 → $1.25 per million input tokens, GPT-4 (Mar 2023) to GPT-5 (Aug 2025) |
| Shakeout of many firms | Car makers 272 → 9; 198 airline bankruptcy filings; 27,000+ rail miles in receivership (1893); US IPOs 476 → 66; sector index falls of −93% (airlines), −92% (telecom), −83% (chips), −95% and −98% (Nokia, BlackBerry) | Partly (early) | Licence-and-hire absorptions (Inflection, Character.AI, Windsurf, Scale AI; 2024–25); seed rounds −27% year on year in Q3 2026 10; Gartner forecasts 80% of neoclouds gone or absorbed by 2030. No wave of failures among funded leaders yet |
| A few winners / consolidation | Top three car makers >80% (1930s); four airlines ~85% (2013); three DRAM makers >90% | Partly: yes in infrastructure, not yet in models | Nvidia 75.0% gross margin and $89.0bn data-centre revenue in one quarter (Aug 2026); four hyperscalers ~$720–740bn of 2026 capex; top three DRAM makers 90.5% (Q4 2025). The model layer still has several frontier labs, with open weights about four months behind 11 |
| Gains go to users, not builders | Memory makers created no economic value, 1996–2012 (McKinsey); telecom shareholders lost ~$2tn (~$3.8tn in 2026 dollars) while bandwidth became nearly free; newspapers lost 87% of real ad revenue (2000–20) as information became free | Partly: users gain on price; the supplier earns most; builders are mixed | Falling token prices for users. Anthropic: +12% operating margin for the nine months to Sep 2026 on its own adjusted measure 12, but a GAAP operating loss of $1.26bn and a net loss of $104.0bn (mostly non-cash), with ~$900.9bn of commitments. OpenAI: still loss-making on an adjusted basis, with a reported $10.9bn adjusted operating loss (excluding stock-based compensation) and a −109% adjusted margin in Q3 2026 (unaudited, via WSJ/Reuters) 13. Fortune reports four of the five top spenders free-cash-flow negative in Q3 2026 (Alphabet −$9.1bn) 14, 15 |
Seven cycles
1. Railways: Britain in the 1840s, America from the 1860s to the 1890s
British railway investment peaked in 1847 at about £44 million, roughly 7% of GDP 16. Mitchell’s estimates, as quoted by Campbell, put it at 5.7% of GDP in 1846, 6.7% in 1847 and 4.7% in 1848 17. In the peak year the railway construction workforce was about twice the size of the British Army 18.
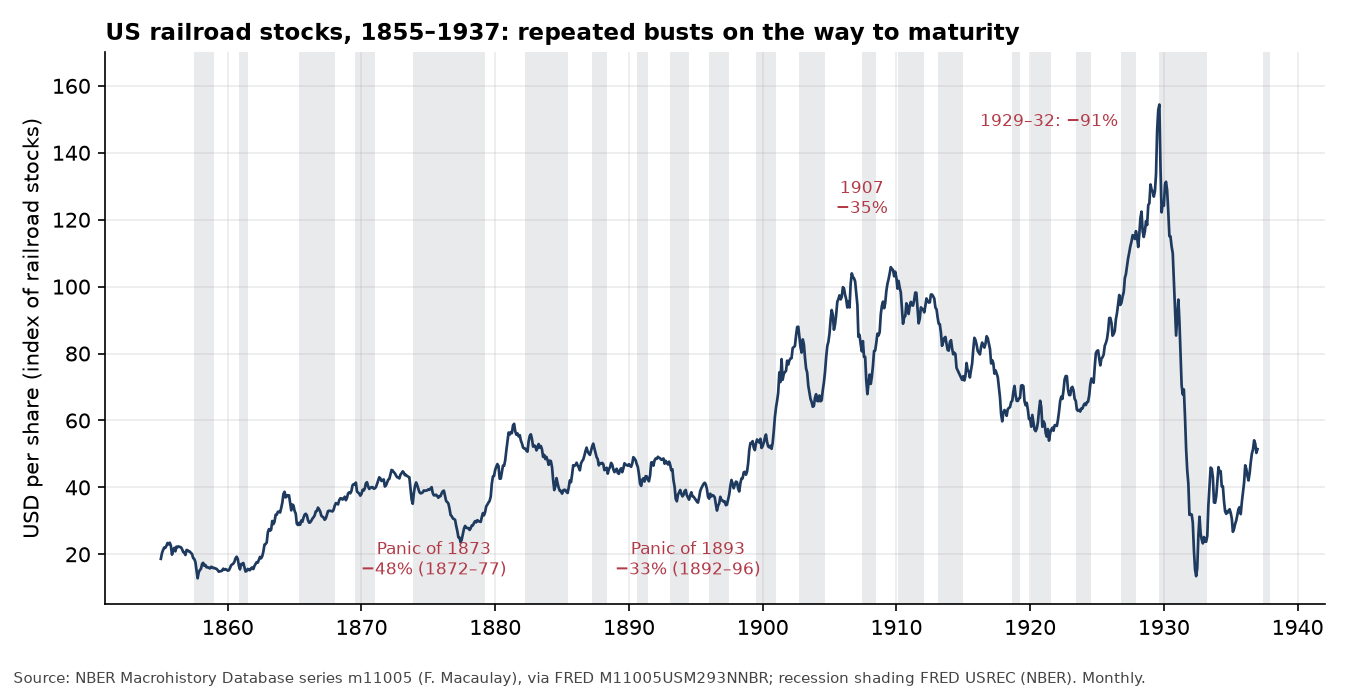
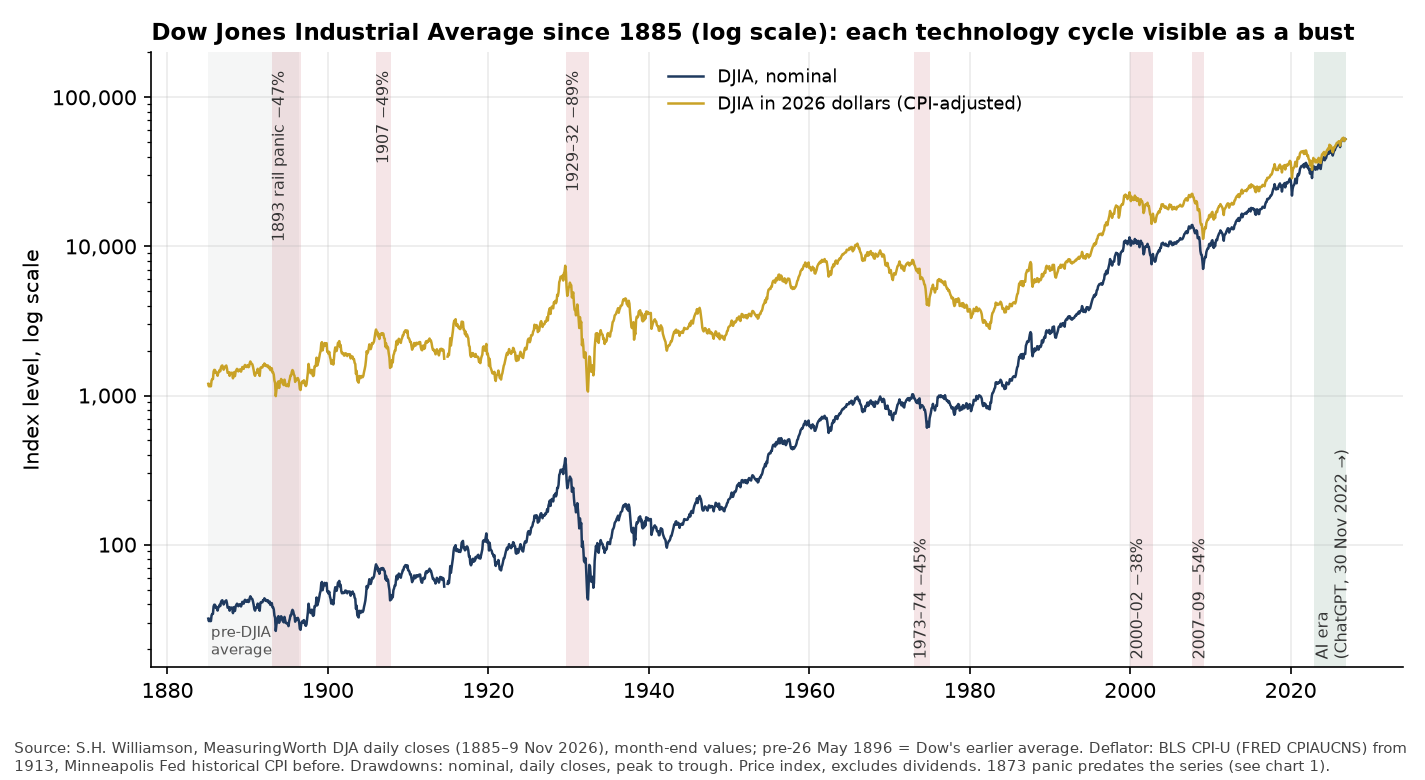
The panic of 1873 opened a contraction that the NBER dates from October 1873 to March 1879; at 65 months it is the longest in the NBER’s chronology 19. Twenty years later, in 1893 alone, more than 27,000 miles of US railroad, capitalised at almost $2 billion (about $75 billion in 2026 dollars), went into receivership, and 40,503 miles were sold at foreclosure between 1894 and 1898 20. US railroad share prices fell 48% from April 1872 to June 1877, 33% from March 1892 to August 1896 and 91% from September 1929 to June 1932 21 (chart 1).
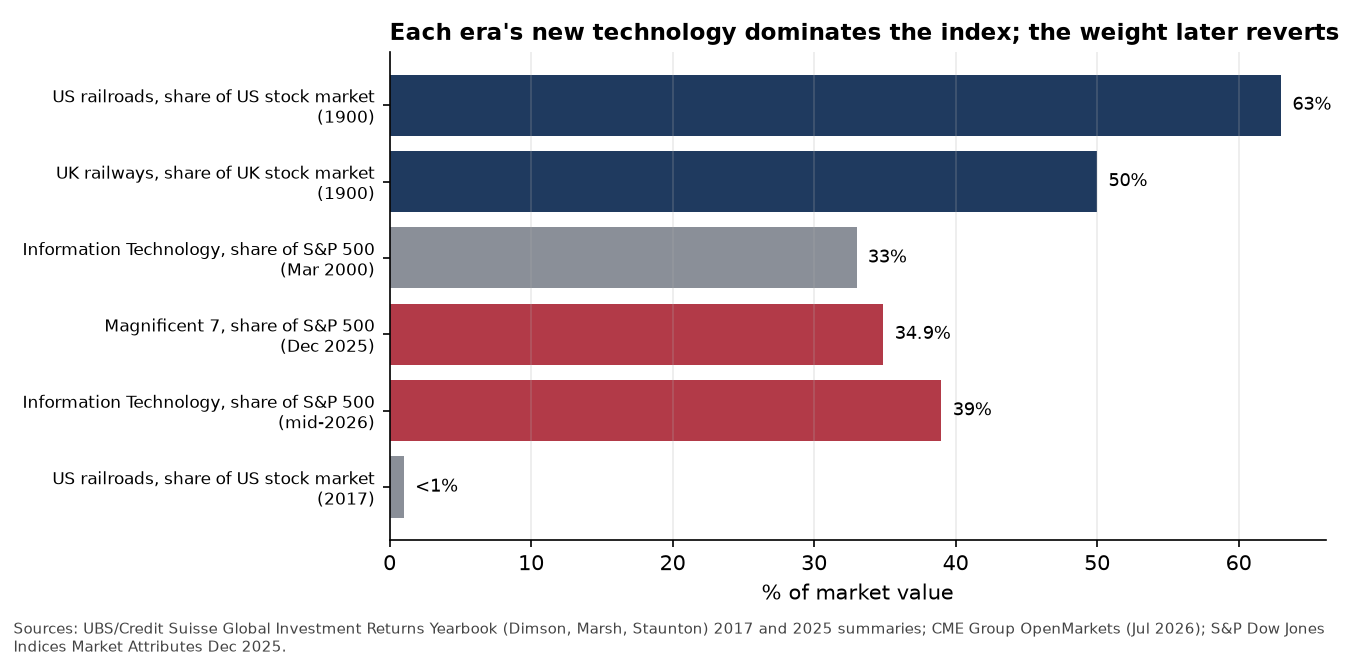
The railways nonetheless became the backbone of both economies. In 1900 they made up 63% of US stock-market value and almost 50% of the UK’s 22. By 2017 they were under 1% of the US market and close to nothing in the UK 23.
2. Cars: America, 1900s to 1940s
The number of US car producers peaked at 272 in 1909 and fell to nine by 1941, even as output grew enormously 24. Ford and General Motors made 38% of output in 1911 and more than 60% by the 1920s; with Chrysler, the top three made more than 80% by the 1930s 25. Ford alone had 50% of the US market by October 1922 26.
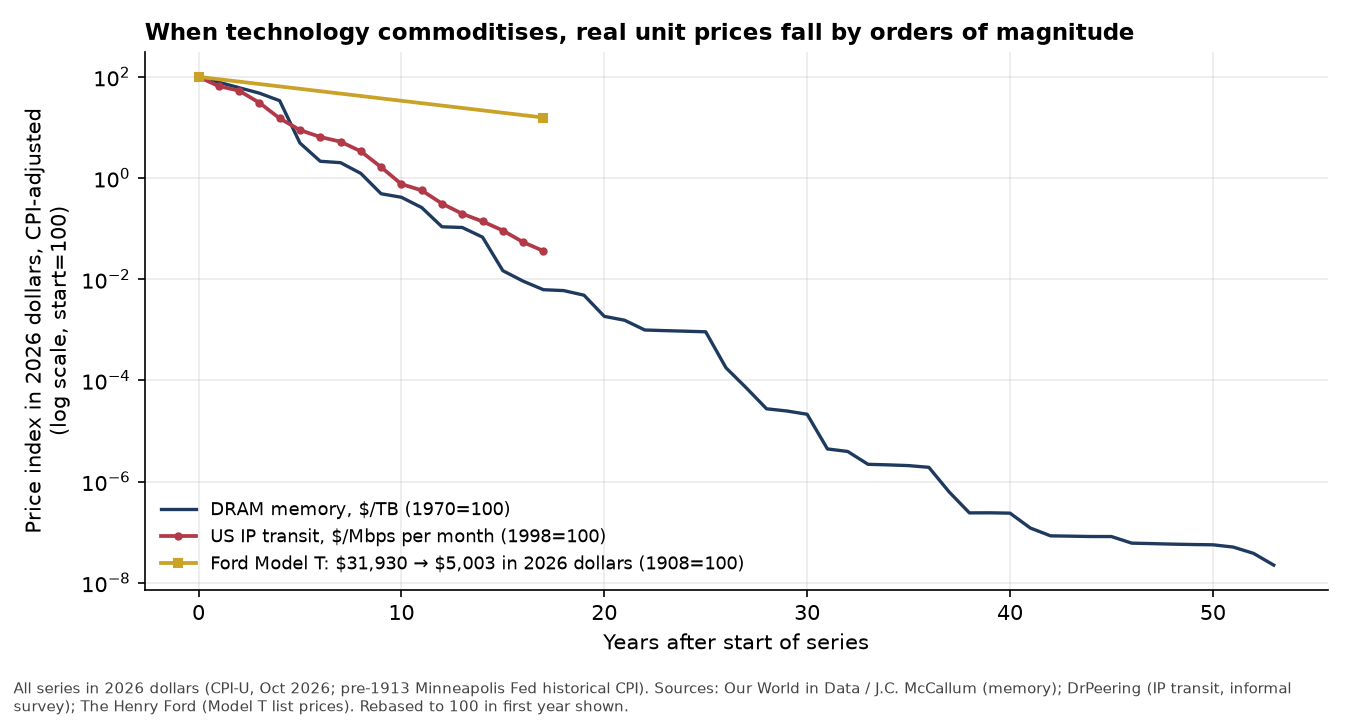
The product’s price collapsed. The Model T launched in 1908 at $850, about $31,900 in 2026 dollars 26. By the early 1920s a two-seat Model T cost as little as $260 27, about $5,000 in 2026 dollars at 1925 prices: a real fall of about 84%. Over the longer run, the CPI for new vehicles fell 67% relative to all-items CPI between 1950 and 2025, on a quality-adjusted basis 28.
Car shares went through the same cycle. Kenneth French’s value-weighted auto portfolio lost 90%, including dividends, between February 1929 and June 1932 29 (chart 14), and 77% (82% in real terms) between April 1999 and February 2009. General Motors left the Dow in June 2009, in bankruptcy.
3. Air travel: America after the 1978 deregulation
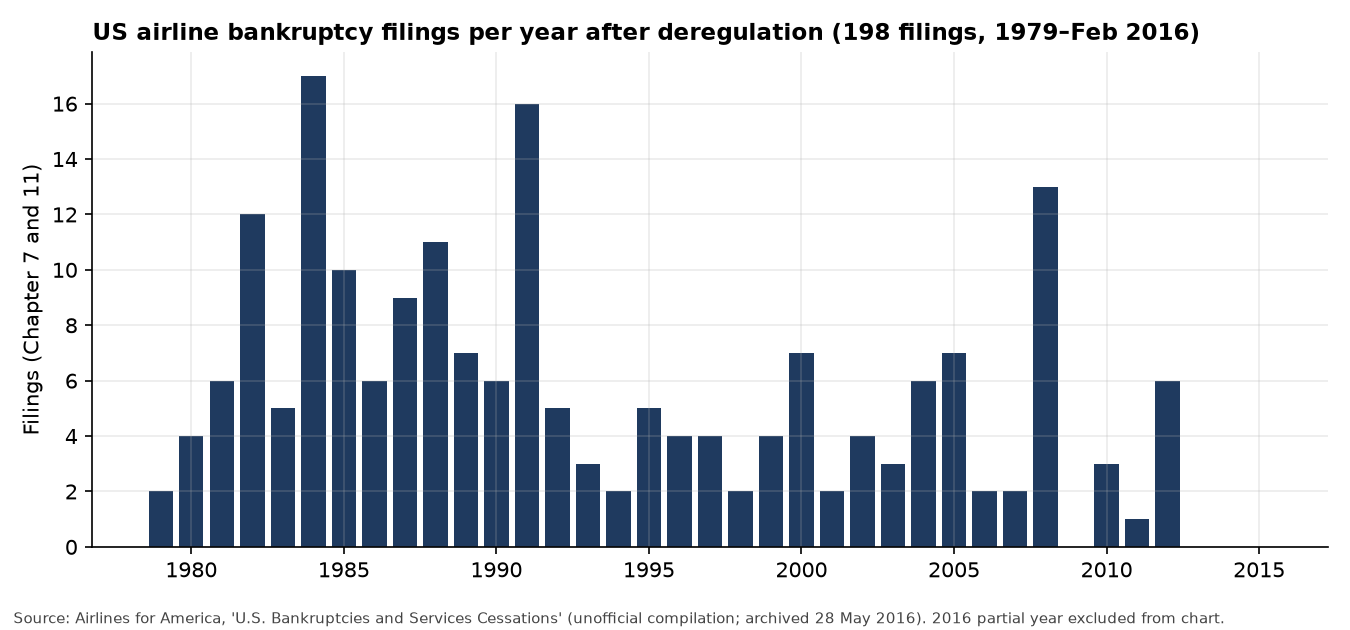
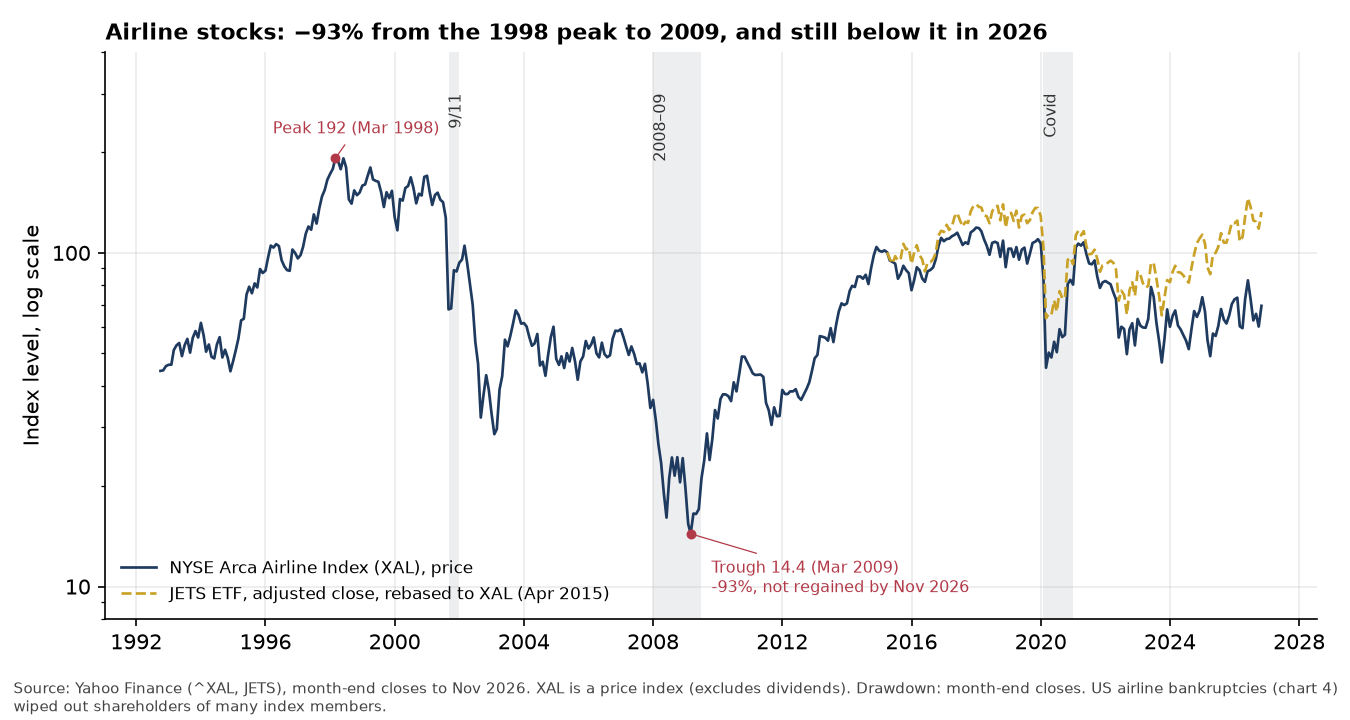
Airlines for America (A4A), the industry body, lists 198 US airline bankruptcy filings between May 1979 and February 2016 in an unofficial compilation 30 (chart 4). After four big mergers from 2007, about 85% of US passengers flew on four domestic airlines in 2013 31.
Passengers were the winners, though how much depends on the measure. Two independent sources put the real fall since deregulation at roughly half. A4A says domestic fares, including bag and change fees, have fallen nearly 50% in real terms since 1978 32; its series averages the fares actually paid, from the Department of Transportation’s ticket survey, plus fee revenue per passenger 33. Severin Borenstein and Nancy Rose find that real domestic yield (revenue per passenger-mile) fell by 2.0% a year from 1978 to 1988 and by 1.9% a year over the following 23 years 34, which compounds to a fall of about 47% from 1978 to 2011 (author’s calculation). They add a caution: real yields were already falling at 2.1% a year in the decade before deregulation, so not all the gain is deregulation’s doing. Since 1995, the government’s own ticket data show the average inflation-adjusted domestic itinerary fare falling 37.3%, from $618 to $387 in 2025 dollars (about $648 and $406 in 2026 dollars) 35.
One measure disagrees. The BLS CPI airline-fare index, divided by all-items CPI, is about 14% higher in 2025 than in 1978, even though it falls about 36% from 1995 to 2025, in line with BTS 36. The gap lies in the early years: until shortly before 1994, BLS priced unrestricted full-fare tickets that relatively few passengers bought 37, and a later hedonic study finds an upward bias in the BLS airfare index 38. Fares actually paid and revenue per mile are the better guide to what passengers spent.
Shareholders paid. The NYSE Arca Airline Index fell 93% from March 1998 to March 2009 on month-end closes, and in November 2026 it was still about 64% below its 1998 peak 39 (chart 10). Yahoo’s pre-1999 levels are about half those quoted at the time, consistent with a 2:1 rebase applied to the whole history, so the percentage falls compare like with like (see the data page).
4. Digital electronics: memory, chips and PCs
The real price of computer memory fell from about $4.9 trillion per terabyte in 1970 to about $1,088 in 2023, in constant 2020 dollars 40: about $6.4 trillion and $1,420 in 2026 dollars.
The industry consolidated as prices fell. The top ten DRAM makers had about 80% of the market in 1995; by 2013–14 three firms (Samsung, SK Hynix and Micron) had more than 90%. Along the way Qimonda and Elpida went bankrupt, and Hitachi, IBM, LG, Mitsubishi, NEC and Texas Instruments left the business. McKinsey concluded that memory makers “were not able to create economic value between 1996 and 2012”, even though their innovations drove the industry’s growth 41. The number of firms making leading-edge chips fell from 29 in 2001 to six by 2016 41.
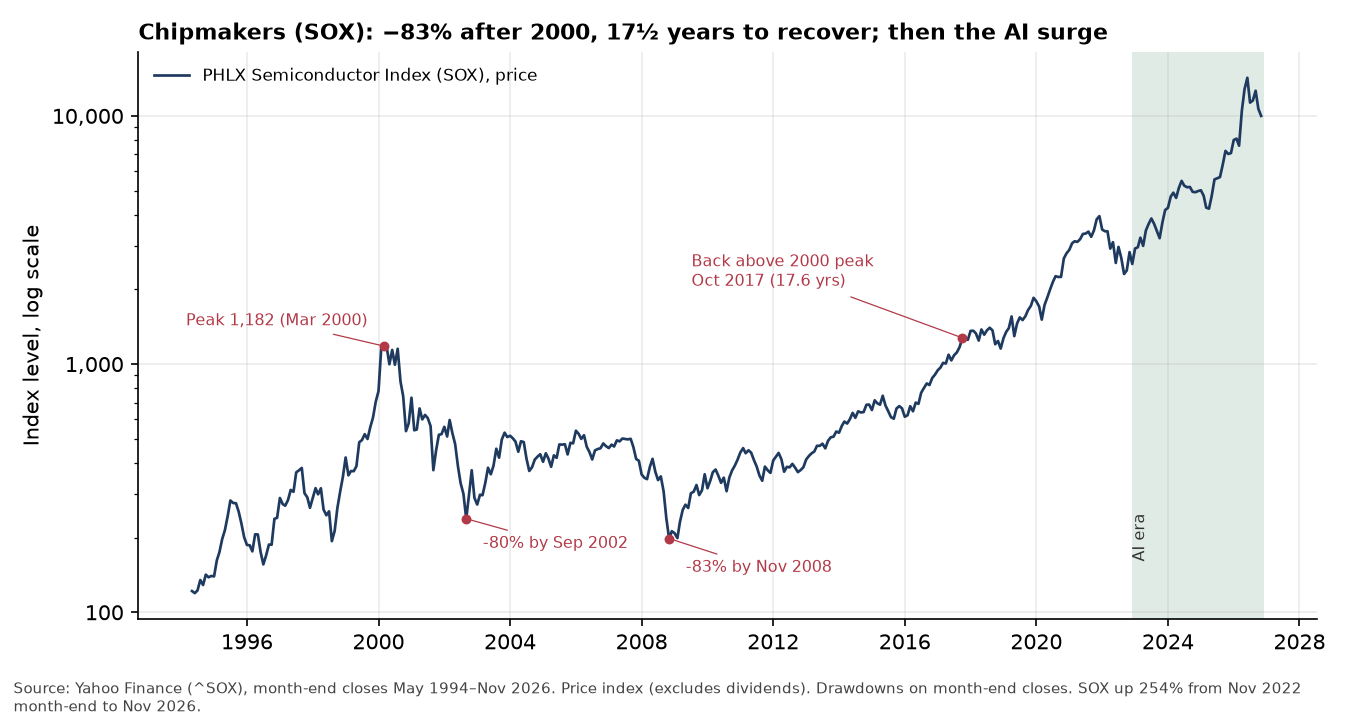
The PHLX Semiconductor Index fell 80% from March 2000 to September 2002 and 83% by November 2008, on month-end closes. It took until October 2017, 17.6 years, to regain its 2000 peak 5 (chart 11).
5. The internet and telecom fibre, 1996–2002
In the five years after the US Telecommunications Act of 1996, carriers put more than $500 billion into fibre, switches and wireless networks: roughly $1 trillion in 2026 dollars, at 2000 prices. No more than 2% of North American long-distance capacity was in use. Shareholders lost roughly $2 trillion (about $3.8 trillion in 2026 dollars, at 2002 prices) and about half a million telecom workers lost their jobs 42. Global Crossing filed for Chapter 11 on 28 January 2002 and WorldCom on 21 July 2002, then the largest bankruptcy in US history 43.
The price of carrying data collapsed. IP transit fell from $1,200 per Mbps per month in 1998 to $0.63 in 2015 44, or from about $2,480 to $0.90 in 2026 dollars.
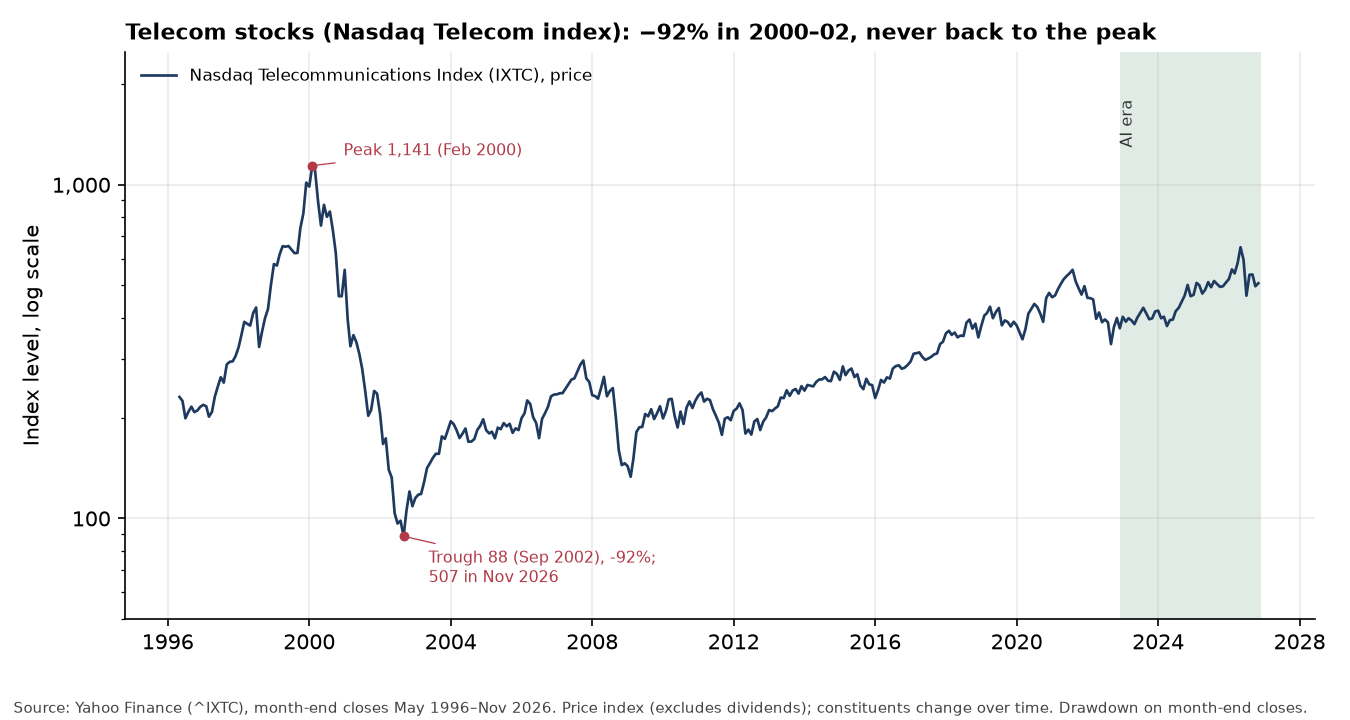
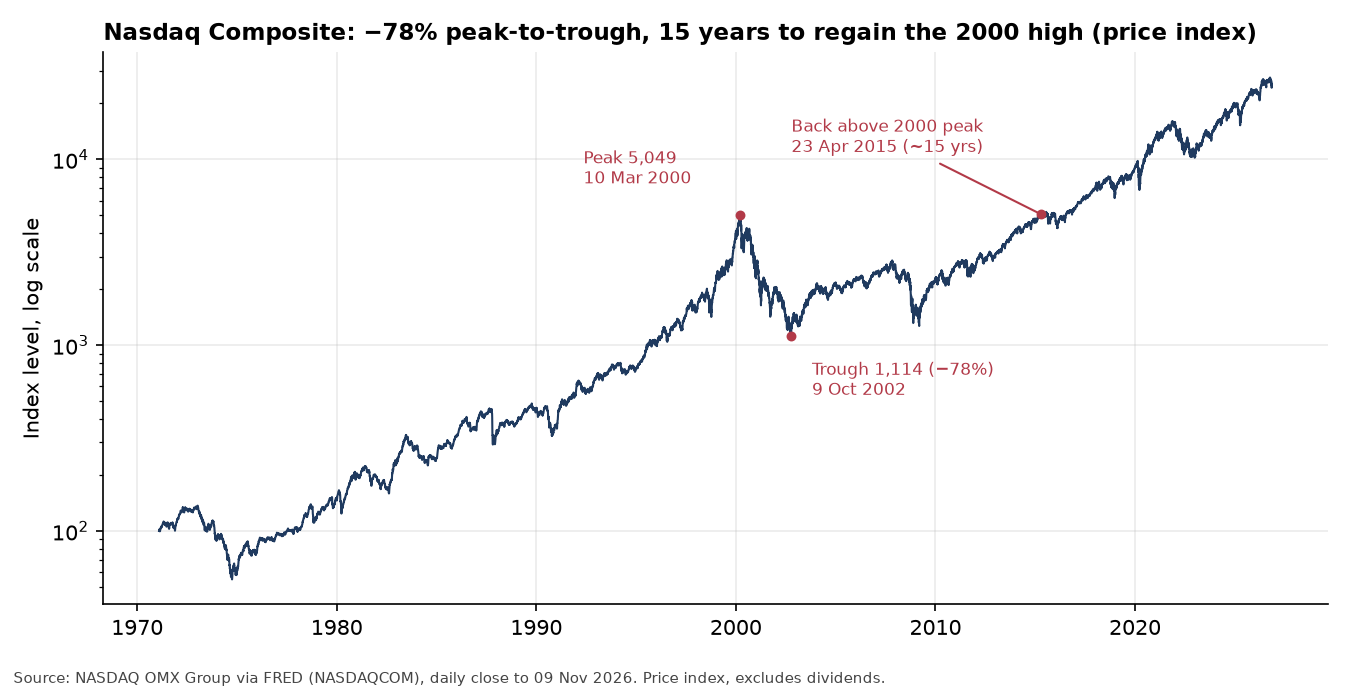
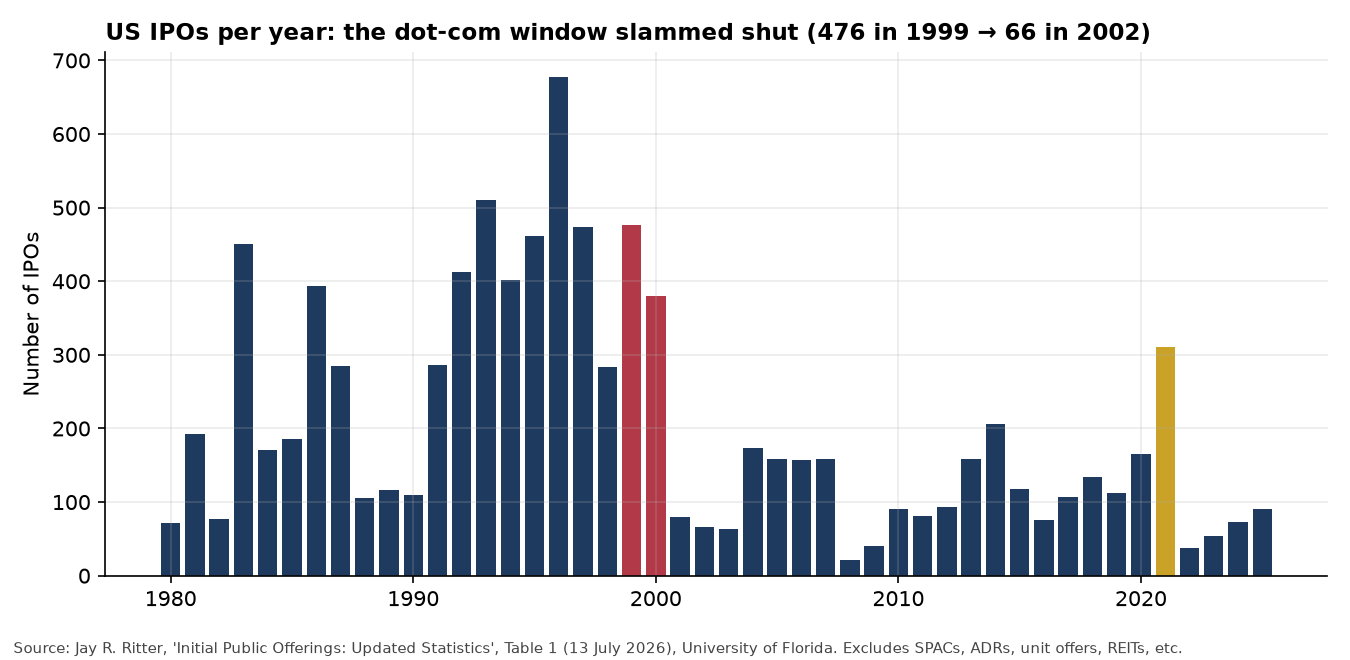
The listed sector never fully recovered. The Nasdaq Telecommunications Index fell 92% from February 2000 to September 2002, and in November 2026 it was still less than half its 2000 peak 45 (chart 12). The Nasdaq Composite fell 78% from its 10 March 2000 close of 5,048.62 to 1,114.11 on 9 October 2002, and did not close above the 2000 peak again until 23 April 2015 46 (chart 6). The US IPO window shut: 476 operating-company IPOs in 1999 and 380 in 2000 became 80 in 2001, 66 in 2002 and 63 in 2003 47 (chart 3).
6. Information services: newspapers, search and online information
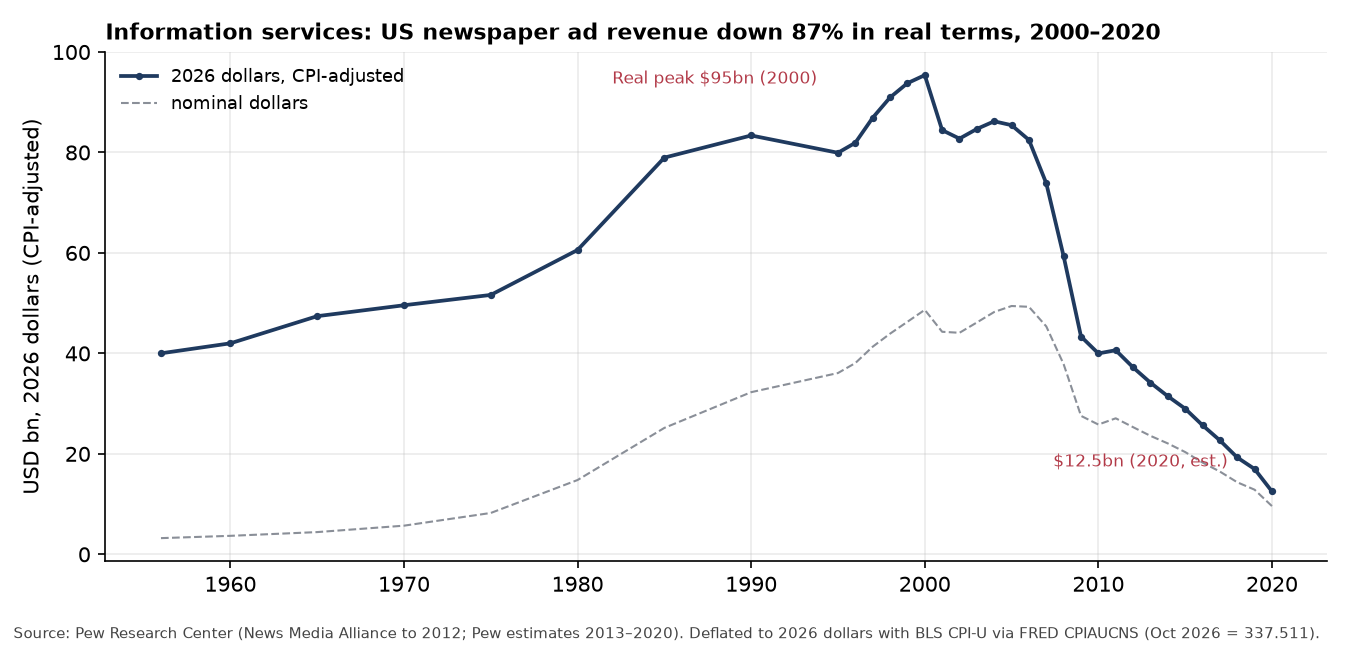
US newspaper advertising revenue peaked in nominal terms at $49.4 billion in 2005 (about $85 billion in 2026 dollars). Pew estimates it at $9.6 billion in 2020, about $12.5 billion in 2026 dollars 48. In real terms the peak came earlier, at $48.7 billion in 2000 (about $95 billion in 2026 dollars); from there, real revenue fell 87% by 2020 (author’s calculation; chart 8).
Information became abundant and almost free to users, while discovery consolidated. Google had 91% of worldwide search-engine referrals in October 2026, according to StatCounter (91.05% on its published page, 91.04% in its CSV export), and it has sat between about 90% and 91% throughout 2026 49, 50. StatCounter counts clicks from search engines to websites, not searches.
7. Mobile phones: the 2000s and 2010s
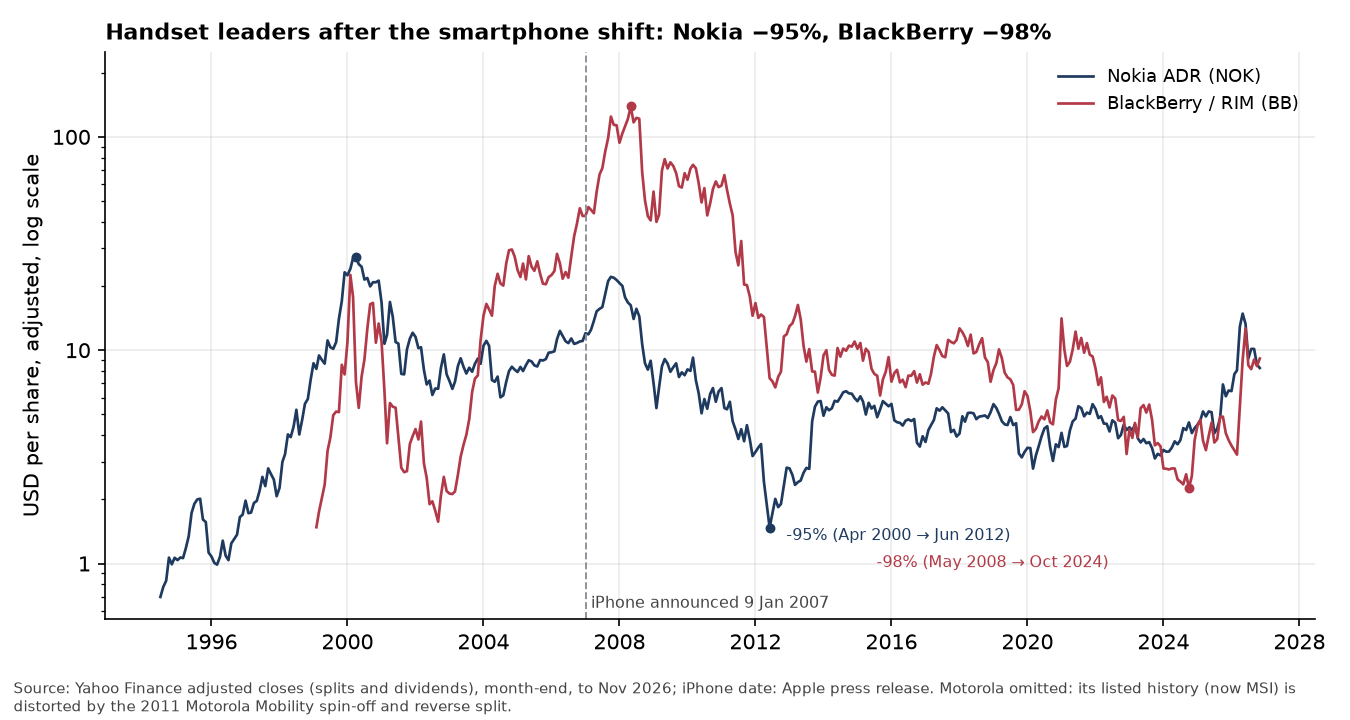
Nokia had 49.4% of worldwide smartphone sales to end users in 2007, according to Gartner’s March 2009 release (60.5 million of 122.3 million units) 51, 52. Six years later Microsoft bought Nokia’s devices business 53. In July 2015 Microsoft wrote down about $7.6 billion on that business (about $10.8 billion in 2026 dollars) and cut up to 7,800 jobs 54. BlackBerry maker Research In Motion left the Nasdaq-100 in December 2012 55.
On adjusted month-end prices, Nokia’s US-listed shares fell 95% from April 2000 to June 2012, and BlackBerry’s fell 98% from May 2008 to October 2024 56, 57 (chart 13). Meanwhile the product went everywhere: mobile subscriptions rose from 0.2 per 100 people worldwide in 1990 to 50.6 in 2007 and 111.5 in 2025 58.
Across the seven: prices fell by orders of magnitude
Once a sector shrinks to three or four players, the survivors often regain pricing power. US airlines held capacity growth below demand after 2009, and real fares in 2012 were about 4% above 2007 before fees 31. DRAM, a byword for commodity pricing, saw conventional contract prices rise 45–50% quarter on quarter in Q4 2025 on AI-driven demand, with the top three makers holding 90.5% of the market (Samsung 36.0%, SK Hynix 32.1%, Micron 22.4%) 59. Commoditisation is a phase, not a permanent state.
Why it matters for a book
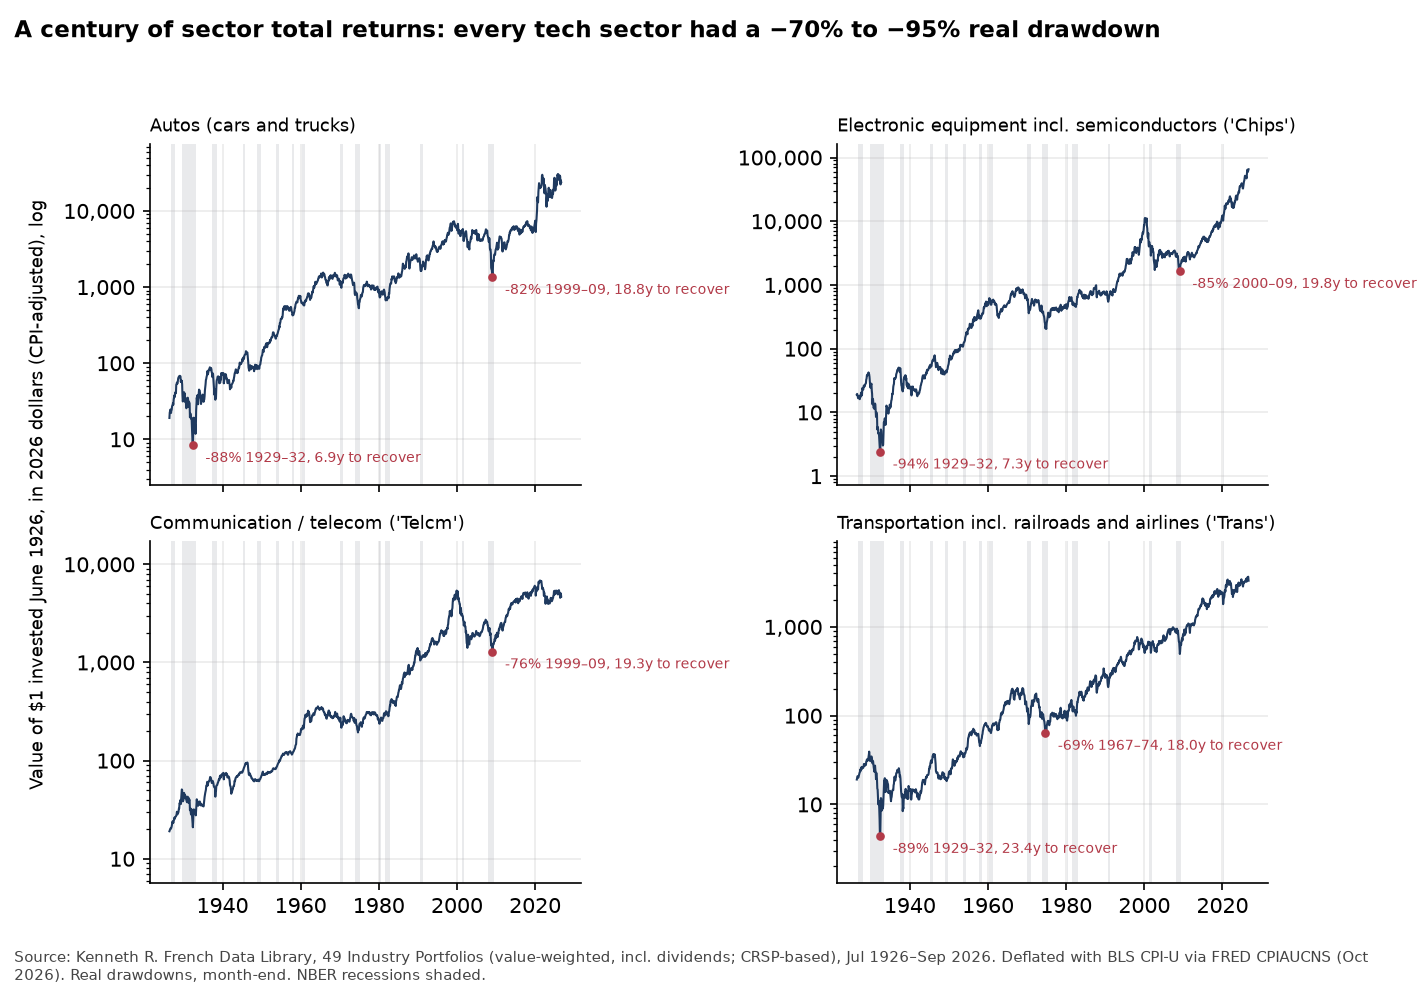
The technology is not the trade. Railways, cars, fibre and mobile phones all won; many of the firms and investors who financed them lost. Every technology sector index and fallen leader in this note suffered a peak-to-trough fall of between 70% and 98%: airlines −93%, telecom −92%, chipmakers −83%, autos −90% in 1929–32, Nokia −95% and BlackBerry −98% (charts 10–14). Several never regained their peak. The positions that paid were usually the survivors bought after the shakeout, the suppliers with genuine scarcity, and the users.
The macro footprint is the risk. British railway investment of 6–7% of GDP in the 1840s ended in a bust. Telecom’s more than $500 billion (roughly $1 trillion in 2026 dollars) ended in the 2001 recession and a lost decade for the Nasdaq. Even the broad Dow took 25 years to regain its 1929 high in nominal terms and almost 30 years in real terms (chart 9). Today US investment in information-processing equipment and software is a larger share of GDP than at the 2000 peak (chart 5). A slowdown in that line would feed straight into GDP prints, credit and index earnings.
Index concentration cuts both ways. Each era’s new technology came to dominate the index: railroads at 63% of US market value in 1900, information technology at about 33% of the S&P 500 in March 2000, the Magnificent Seven at 34.9% at the end of 2025 (chart 7). Each time the weight later came down, through index exits as much as through prices. A passive book is, by construction, long whatever the last cycle’s winners were.
AI: what the evidence shows so far
All figures are date-stamped. Figures dated 2026 are already in 2026 dollars.
The price collapse is already here
Epoch AI finds that the price of reaching a fixed level of large-language-model performance fell by between 9× and 900× a year, depending on the benchmark (median 50×), and faster after January 2024 8. Andreessen Horowitz’s “LLMflation” note of November 2024 puts the decline at about 10× a year at constant quality, comparing GPT-3 at $60 per million tokens in November 2021 (about $75 in 2026 dollars) with Llama 3.2 3B at $0.06 (about $0.06 in 2026 dollars) 9.
OpenAI’s own list prices point the same way. GPT-4 launched in March 2023 at $30 per million input tokens and $60 per million output tokens, about $33 and $66 in 2026 dollars 60. GPT-4o mini launched in July 2024 at $0.15 and $0.60, about $0.16 and $0.65 61. GPT-5, a far more capable model, launched in August 2025 at $1.25 and $10, about $1.31 and $10.48 62. Inflation over 2023–25 is trivial next to these falls. Frontier prices fall more slowly than fixed-capability prices, because each new model resets the top.
The advantage diffuses quickly
Open-weight models trailed the best closed models by about three months on average from January 2023 to October 2025; since January 2026 the gap has been about four months 63, 11. The DeepSeek day in January 2025, when Nvidia lost 17%, was the market’s first sharp lesson in what diffusion can do to a valuation. It did not last: Nvidia closed at $142.62 on 24 January 2025, the session before; it first closed back above that level on 9 June 2025 64 and set a record close of $154.31 on 25 June 2025 65, 66. On 13 November 2026 it closed at $162.85, about 14% above its pre-DeepSeek close, for a market value of about $3.9 trillion 67, 68. That was after six straight weekly falls that took about 30%, or roughly $1.7 trillion, off its value from early October, the last of which CNBC and Reuters tied to the departure of chief executive Jensen Huang, who resigned on 12 November 2, 93.
The capex boom is at a record
After the October 2026 results, 2026 capital-expenditure guidance stands at about $220 billion for Amazon (cash capex) 69, $195–205 billion for Alphabet, about $170 billion for Microsoft for calendar 2026 (cut from $175 billion) and $135–145 billion for Meta, including finance-lease principal (Meta raised the bottom of its range from $130 billion) 70, 71, 72, 14. That is roughly $720–740 billion for the four, or up to $828 billion including SpaceX/xAI 14, 73. Fortune reports that several banks expect AI capex to reach $1 trillion in 2027 14. Fortune also reports that four of those five spenders had negative free cash flow in Q3 2026, with Microsoft the exception 14. Alphabet’s own figures partly back this up: it reported negative free cash flow of $9.1 billion ($9,065 million) for the quarter, as $51.4 billion of capex outran $42.3 billion of operating cash flow 15, 74.
In the national accounts, US investment in information-processing equipment and software reached 5.35% of GDP in Q3 2026, above the dot-com peak of 4.46% in Q4 2000 1 (chart 5). Jason Furman calculated that these categories accounted for 92% of US GDP growth in the first half of 2025 75. Two caveats: the BEA category also covers ordinary IT spending, not only AI; and Furman calls his 92% an accounting result rather than a counterfactual, since lower interest rates or energy prices might have filled part of the gap.
The shakeout has started, quietly
Big platforms are absorbing start-ups through licence-and-hire deals rather than outright acquisitions. Microsoft paid about $650 million in its March 2024 deal with Inflection (about $700 million in 2026 dollars) 76. CNBC reports about $2.7 billion for Google–Character.AI, $2.4 billion for Google–Windsurf and $14.3 billion for Meta’s 49% stake in Scale AI (about $2.9 billion, $2.5 billion and $15.0 billion in 2026 dollars) 77; these values are press-reported, not fully disclosed in filings.
Carta’s Q3 2026 data show money still flowing but to fewer companies. Deal count fell 21% year on year and seed rounds fell 27% to 426, while AI took 52% of capital raised in 2026 to date and 57% at Series B and later 10. Gartner forecasts that by 2030, 80% of neocloud companies will have been absorbed or will have ceased operating 70. That is a forecast, not an outcome.
So far, the supplier captures the gains
Nvidia’s second quarter of fiscal 2027 (to 26 July 2026) brought revenue of $96.2 billion, $89.0 billion of it from data centres, at a 75.0% gross margin 78.
The model builders are mixed. Anthropic’s second amended S-1, filed on 10 November 2026, shows revenue of $33.24 billion for the nine months to 30 September 2026 and a net loss of $104.0 billion. Most of that loss is non-cash: $94.3 billion came from changes in the fair value of convertible notes, derivative liabilities and SAFEs, and a further $10.3 billion from other mark-to-market instruments. On a GAAP basis Anthropic still made an operating loss, of $1.26 billion for the nine months; on its own adjusted measure, which excludes items such as stock-based compensation and non-cash charitable contributions, its operating margin was +12% 12, 79. The filing puts Anthropic’s committed spend at about $900.9 billion, “substantially all” on compute and infrastructure, up from the $895.4 billion in its first amendment of 2 November; about $451.6 billion of it falls due before the end of 2030 12, 79.
OpenAI is private and its figures are unaudited. The Wall Street Journal, as reported by Reuters, says OpenAI’s Q3 2026 revenue was about $10 billion, with an adjusted operating loss of $10.9 billion and an adjusted operating margin of −109% 13, 80. Computing reports that the adjusted figure excludes stock-based compensation 80. So on the companies’ own adjusted measures, Anthropic is in profit and OpenAI is still loss-making; neither adjusted figure is audited, and the two are not defined identically.
Sequoia’s David Cahn framed the gap in June 2024 as “AI’s $600B question” (about $646 billion in 2026 dollars): the end-user revenue needed to justify the infrastructure spend 81. Users already enjoy falling unit prices. Whether users or builders keep the surplus is still open.
Concentration is at a record; turnover has barely begun
The Magnificent Seven were 34.9% of the S&P 500 at the end of 2025 (33.5% at the end of 2024) and produced 42% of the index’s 2025 return 82. CME Group puts information technology at roughly 39% of the index in mid-2026, above every previous sector peak it reviewed, and notes that the 12-month correlation between the S&P 500 and the Nasdaq-100 hit a record 0.98 in March 2026 83.
The only AI-era turnover in the blue-chip index so far is Nvidia replacing Intel in the Dow in November 2024, 25 years after Intel arrived. On prices, the Dow rose 51% from its 30 November 2022 close of 34,589.77 to 52,347.55 on 13 November 2026, or 33% in 2026 dollars (chart 9). On month-end closes, the PHLX Semiconductor Index rose about 404% from November 2022 (2,827) to its June 2026 high (14,247), then fell 30% to 9,998 on 10 November 2026, leaving it 254% above November 2022 (chart 11). It closed at 10,146 on 13 November. That 30% fall is a correction so far, not a bust on the scale of 2000–02.
Can history predict AI’s future?
History predicts the shape of the cycle better than its timing. Three lessons travel well.
Prices fall first, and further than incumbents expect. In every case unit prices fell by one to several orders of magnitude. For AI this is already happening at constant capability.
Capacity overshoots before the shakeout, and the bust follows the capex peak, not the technology peak. After those peaks the sector indices fell 70–98% and took roughly 14–18 years to recover, or never did (charts 10–14). Railways (1847, 1873, 1893) and telecom (2000–02) both turned when investment ran ahead of the revenue that could service it. AI capex relative to GDP is now above the 2000 peak, and the builders are financing part of it with debt and equity. Microsoft priced $25 billion of senior notes in ten tranches on 29 October 2026, for general corporate purposes that may include capital expenditure 84, 85. Meta priced $37.5 billion of underwritten equity on 26 October: $12.5 billion of 6.50% mandatory convertible preferred stock (250 million depositary shares at $50) and $25 billion of Class A common stock (40 million shares at $625) sold under forward sale agreements. The underwriters exercised their option on the common in full on 4 November, taking it to $28.75 billion. They had already taken up their option on the preferred in full on 29 October: Meta issued 37.5 million more depositary shares on 2 November, for net proceeds of about $1.87 billion 92. Meta also said it plans an at-the-market programme of about $60 billion once its new Class C shares begin trading; its filings through 15 November show no such programme yet. Together with the roughly $35 billion of underwritten offerings announced at launch, that plan is the “up to $95 billion” Fortune reported 86, 87, 88, 89, 90, 14. Meta has borrowed as well: it completed $15 billion of dollar bonds on 5 November and €9 billion of euro bonds on 12 November 90, 91.
Consolidation creates a few durable winners, often not the early leaders. Ford’s lead gave way to General Motors. Nokia gave way to Apple and Android. AltaVista and Yahoo gave way to Google. Survivors often regain pricing power later, as airlines did after 2009 and DRAM makers did in 2025.
Where AI may differ: the main spenders are some of the most profitable companies in history, funding most of their capex from operating cash flow, though that cushion is thinning. Railways and telecom were funded by leveraged newcomers. That could make any shakeout slower and shallower at the top of the index, and harsher among leveraged neoclouds and single-product start-ups.
What to watch
Observable indicators, not recommendations.
BEA quarterly GDP: information-processing equipment and software as a share of GDP, and its contribution to growth. A turn in this line marked the start of the 2001 bust.
Hyperscaler guidance against cloud revenue: changes to capex guidance (Microsoft’s cut from $175 billion to $170 billion in October 2026 was the first), free cash flow, and bond or equity issuance to fund capex.
Price per token at fixed capability, and the open-weight gap: Epoch AI’s trackers. A widening gap would argue against commoditisation at the frontier.
Neocloud credit and the IPO window: withdrawn listings, financing costs and the Gartner thesis. The dot-com IPO count halved within two years of the peak 47.
Sector index drawdowns: the PHLX Semiconductor Index against its June 2026 high, and whether a correction becomes the 80%-plus falls seen after 2000 (charts 11–14).
Memory contract prices (HBM and DRAM): TrendForce, quarterly. A consolidated supplier layer with rising prices is the opposite of commoditisation, until capacity catches up.
AI lab disclosures: Anthropic’s IPO pricing and post-listing filings, OpenAI’s reported margins, and revenue growth against compute commitments.
Index weights and constituent changes: Magnificent Seven and IT weights, the gap between cap-weighted and equal-weighted indices, and any AI-era exits from the Dow, the S&P 500 or the Nasdaq-100.
Start-up mortality: Carta’s shutdown and deal-count data, and licence-and-hire deals that leave “zombie” companies behind.
Blindspot notes are research, not investment advice. Nothing here is a recommendation to buy or sell any security.
Key points
- Every big technology of the past 180 years, from railways to mobile phones, went through a price collapse, a shakeout and a handful of winners. The sector indices fell between 70% and 98%, and the bust came after the peak in capital spending, not the peak in the technology.
- AI already shows the price collapse and a record build-out. US investment in information-processing equipment and software reached 5.35% of GDP in the third quarter of 2026, above the 4.46% dot-com peak, while OpenAI’s list price per million input tokens fell from $30 for GPT-4 to $1.25 for GPT-5.
- The shakeout, and the fight over who keeps the gains, have only just begun. For now the main supplier keeps the margin, the Magnificent Seven made up a record 34.9% of the S&P 500 at the end of 2025, and the chip index sits about 29% below its June close.
Data and sources
The full data tables (economic footprint, index membership, the Dow and sector drawdowns, price collapses, firm counts), caveats, data licences and the complete source list are on the MoneyTurkey data page.
Notes
1 Money convention: dollar figures appear as originally reported (nominal). The opening section (Steam to Chips) uses nominal figures only; the body gives the 2026-dollar equivalent alongside wherever it shows one. The deflator is the BLS CPI-U (all items, not seasonally adjusted; FRED CPIAUCNS): the October 2026 reading of 337.511 divided by the annual-average CPI of the year the price applies to. Before 1913 the series is the Minneapolis Fed’s historical CPI table (Minneapolis Fed), chain-linked to CPI-U at 1913; the Minneapolis Fed calls pre-1913 values estimates. The 2025 average uses 11 months, because BLS did not publish October 2025. Multi-year totals are converted at a stated single year. Figures already dated 2026 are not converted; sterling and euro figures are not converted.
Sources
- BEA via FRED, private fixed investment in information-processing equipment and software (A679RC1Q027SBEA), author’s ratio to GDP, A679RC1Q027SBEA; GDP.
- CNBC, Nvidia six-week slide, 13 November 2026, cnbc.com.
- Nasdaq, PHLX Semiconductor Index overview, indexes.nasdaq.com.
- FRED/ALFRED, NASDAQSOX (PHLX Semiconductor Index), release of 13 November 2026, alfred.stlouisfed.org.
- Yahoo Finance, PHLX Semiconductor Index history, author’s calculation, finance.yahoo.com.
- Reuters, “China’s DeepSeek sets off AI market rout”, 27 January 2025, reuters.com.
- Yahoo Finance, “Nvidia sheds $1 trillion from record-high market cap as market sell-off intensifies” ($589 billion figure), finance.yahoo.com.
- Epoch AI, LLM inference price trends, epoch.ai.
- Andreessen Horowitz (a16z), “LLMflation: LLM inference cost”, November 2024, a16z.com.
- Carta, State of Private Markets Q3 2026 full report, 5 November 2026, carta.com.
- Epoch AI, open- versus closed-weight ECI gap, 2026, epoch.ai.
- Anthropic, S-1/A (Amendment No. 2), SEC EDGAR, 10 November 2026, sec.gov.
- Reuters via Investing.com, “OpenAI posts steep losses even as quarterly revenue rises to $10 billion, WSJ reports”, 10 November 2026, investing.com.
- Fortune, “Big Tech AI capital spending spree”, 31 October 2026, fortune.com.
- Alphabet, Q3 2026 earnings release (Exhibit 99.1), SEC EDGAR, sec.gov.
- Odlyzko, 2010, hallucinations.pdf.
- Campbell, 2013, RailwayDeriving.pdf.
- Odlyzko, railway construction workforce compared with the British Army, mania05.pdf.
- NBER, US business cycle expansions and contractions, nber.org.
- Stuart Daggett, Railroad Reorganization, 1908, gutenberg.org.
- NBER Macrohistory m11005 (Macaulay) via FRED (M11005USM293NNBR), author’s calculation, fred.stlouisfed.org.
- UBS Global Investment Returns Yearbook 2025, ubs.com.
- Credit Suisse Global Investment Returns Yearbook 2017, credit-suisse-global-investment-returns-yearbook-2017-en.pdf.
- Steven Klepper, NBER conference paper on the US automobile industry, 2009, nber.org.
- Steven Klepper, Revue de l’OFCE, 2006, ofce.fr.
- The Henry Ford, “Ford’s Model T”, thehenryford.org.
- The Henry Ford, Model T artifact note (artifact 74347), thehenryford.org.
- FRED, CPI for new vehicles (CUUR0000SETA01) and all-items CPI (CPIAUCNS), author’s calculation, CUUR0000SETA01; CPIAUCNS.
- Kenneth R. French Data Library, 49 Industry Portfolios (value-weighted), author’s calculation, dartmouth.edu.
- Airlines for America (A4A), unofficial compilation of US airline bankruptcies and service cessations, archived 28 May 2016, web.archive.org.
- US Government Accountability Office, GAO-14-515, Airline Competition, gao.gov.
- Airlines for America (A4A), “As air travel breaks record volumes, U.S. airfares fall to historic lows”, June 2024, airlines.org.
- Airlines for America (A4A), annual round-trip fares and fees, domestic, dataset notes, airlines.org.
- Severin Borenstein and Nancy Rose, NBER chapter on airline pricing and deregulation, nber.org.
- Bureau of Transportation Statistics, 2025 annual average domestic air fare, April 2026, bts.gov.
- FRED, CPI airline fares (CUUR0000SETG01), author’s calculation relative to all-items CPI, fred.stlouisfed.org.
- Federal Reserve Bank of Dallas, Economic Review, 1994 Q2, dallasfed.org.
- Good, Sickles and Weiher, Review of Income and Wealth, 2008, doi.org.
- Yahoo Finance, NYSE Arca Airline Index history, author’s calculation, finance.yahoo.com.
- Our World in Data / J.C. McCallum, historical cost of computer memory and storage, ourworldindata.org.
- McKinsey, “Memory: Are challenges ahead?”, 2016, mckinsey.com.
- Robert E. Litan, “The Telecommunications Crash: What To Do Now”, Brookings, December 2002, brookings.edu.
- Optica/OSA, “Boom, Bubble, Bust: The Fiber Optic Mania”, internethistory.org.
- DrPeering, Internet transit prices, drpeering.net.
- Yahoo Finance, Nasdaq Telecommunications Index history, author’s calculation, finance.yahoo.com.
- FRED, NASDAQ Composite (NASDAQCOM), fred.stlouisfed.org.
- Jay R. Ritter, University of Florida, IPO Statistics, ufl.edu.
- Pew Research Center, newspaper industry estimated advertising and circulation revenue, pewresearch.org.
- StatCounter, search-engine market share (worldwide), gs.statcounter.com.
- StatCounter CSV readout, 1 November 2026, christopholivierconsulting.com.
- Gartner, worldwide smartphone sales to end users, 11 March 2009, pressebox.de.
- BBC, Nokia market-share report, 2013, bbc.com.
- The New York Times, “The end of an era in mobile”, 3 September 2013, nytimes.com.
- Microsoft, “Microsoft announces restructuring of phone hardware business”, 8 July 2015, microsoft.com.
- Nasdaq, annual changes to the Nasdaq-100 Index (Research In Motion departure, December 2012), ir.nasdaq.com.
- Yahoo Finance, Nokia history, author’s calculation, finance.yahoo.com.
- Yahoo Finance, BlackBerry history, author’s calculation, finance.yahoo.com.
- Our World in Data / ITU, mobile-cellular subscriptions per 100 people, ourworldindata.org.
- TrendForce, DRAM market and contract prices, February 2026, trendforce.com.
- OpenAI, GPT-4 research, March 2023, openai.com.
- OpenAI, “GPT-4o mini: advancing cost-efficient intelligence”, July 2024, openai.com.
- OpenAI, “Introducing GPT-5 for developers”, August 2025, openai.com.
- Epoch AI, open-weights versus closed-weights models, epoch.ai.
- Yahoo Finance, Nvidia history, author’s check, finance.yahoo.com.
- CNBC, “Nvidia shares head for record close”, 25 June 2025, cnbc.com.
- Bloomberg, “Nvidia shares rise to record as AI spending momentum continues”, 25 June 2025, bloomberg.com.
- Fund Library, Nvidia Corporation market details, fundlibrary.com.
- GuruFocus, Nvidia market cap, gurufocus.com.
- Amazon, Q3 2026 results, aboutamazon.com.
- CNBC, “Microsoft, Google AI capex estimates”, 29 October 2026, cnbc.com.
- Business Insider, “Microsoft trims AI spending plans to $170b as Azure revenue surges”, October 2026, businessinsider.com.
- Meta, Q3 2026 results, atmeta.com.
- Business Insider, Amazon, Alphabet, Meta, Microsoft and SpaceX capex total, October 2026, businessinsider.com.
- CNBC, Alphabet Q3 2026 earnings, 28 October 2026, cnbc.com.
- Fortune, October 2025 (Jason Furman), fortune.com.
- Reuters, “Microsoft agreed to pay Inflection $650 mln while hiring its staff”, 21 March 2024, reuters.com.
- CNBC, “How AI ‘zombie’ deals work”, 19 August 2025, cnbc.com.
- Nvidia, financial results for second quarter fiscal 2027, 26 August 2026, nvidia.com.
- CNBC, Anthropic S-1 quarter financials, 2 November 2026, cnbc.com.
- Computing, “OpenAI narrows revenue gap with Anthropic but increased losses”, November 2026, computing.co.uk.
- Sequoia, David Cahn, “AI’s $600B question”, June 2024, sequoiacap.com.
- S&P Dow Jones Indices, Market Attributes: U.S. Equities, December 2025, spglobal.com.
- CME Group OpenMarkets, “What Past Sector Concentrations Tell Us About Today’s Tech-Heavy S&P 500”, 2026, cmegroup.com.
- Microsoft, final prospectus supplement, 424B2, filed 2 November 2026, sec.gov.
- Microsoft, 8-K, 4 November 2026, sec.gov.
- Meta, launch announcement, FWP, 26 October 2026, sec.gov.
- Meta, 424B5, mandatory convertible preferred, 28 October 2026, sec.gov.
- Meta, 424B5, Class A common stock, 28 October 2026, sec.gov.
- Meta, 8-K, 29 October 2026, sec.gov.
- Meta, 8-K, 5 November 2026, sec.gov.
- Meta, 8-K, 12 November 2026, sec.gov.
- Meta, 424B5 prospectus supplement for senior notes (“Recent Developments”: full exercise of the over-allotment option in the depositary shares offering), filed 4 November 2026, sec.gov.
- Reuters via Euronext, “Wall Street ends lower as Nvidia CEO resigns; US yields up”, 12 November 2026, live.euronext.com.

